One pattern of comments that I have seen is where the person making the comment points out some particular price change, and asserts that this somehow proves that inflation cannot be 2%. This is a criticism of CPI data that does not stand up to even a brief examination of the official data.
Reminder: Feedburner e-mail is being discontinued in July. To get my articles by mail, please go to my free Substack: https://bondeconomics.substack.com/
I will just look at the United States CPI here, but the situation would be similar for other countries. There are eight major groups of prices in the CPI.
- Food and beverages,
- housing,
- apparel,
- transportation,
- medical care,
- recreation,
- education and communication,
- other goods and services.
Each of these has sub-divisions, which in turn will eventually be the result of averaging the prices of particular goods or services in a location (coming from an extensive survey).
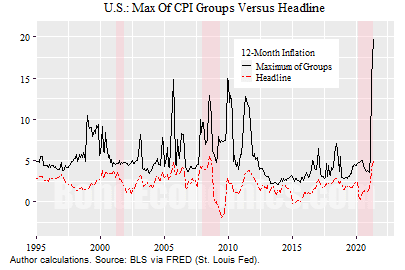
The chart above shows the dispersion of prices within the CPI, just looking at the major group level. It compares the maximum annual inflation rate across the groups versus the reported (headline) CPI figure since 1995.
As can be seen, the maximum inflation rate since 1995 (which is the period where the U.S. has had core CPI sticking around 2%) has often been 5% or even over 10%. Meanwhile, these are major groups — we expect that we can find individual items that have even higher inflation rates.
Therefore, pointing to some particular goods price rising at 10% does not invalidate the CPI: the CPI data tells us that is happening. However, inflation is supposed to be a generalised rise in prices, which is why we take averages.
Finally, this analysis does not “prove” that the CPI is “correct,” rather, the critic would need to come up with an alternative measure, and show that it is higher.
(Note: this analysis is somewhat fragmentary; I will be writing this up later as a section in my inflation primer book.)
Appendix: Economics Platform Update
The above chart was generated using some new functionality added to my open source “economics platform” project. It allows us to create functions that are treated as time series. I give a small update describing this on my Patreon (link).


No comments:
Post a Comment
Note: Posts are manually moderated, with a varying delay. Some disappear.
The comment section here is largely dead. My Substack or Twitter are better places to have a conversation.
Given that this is largely a backup way to reach me, I am going to reject posts that annoy me. Please post lengthy essays elsewhere.